2. The Web User Interface
The User Interface is shown in Fig. 2.1. The application is divided into four sections:
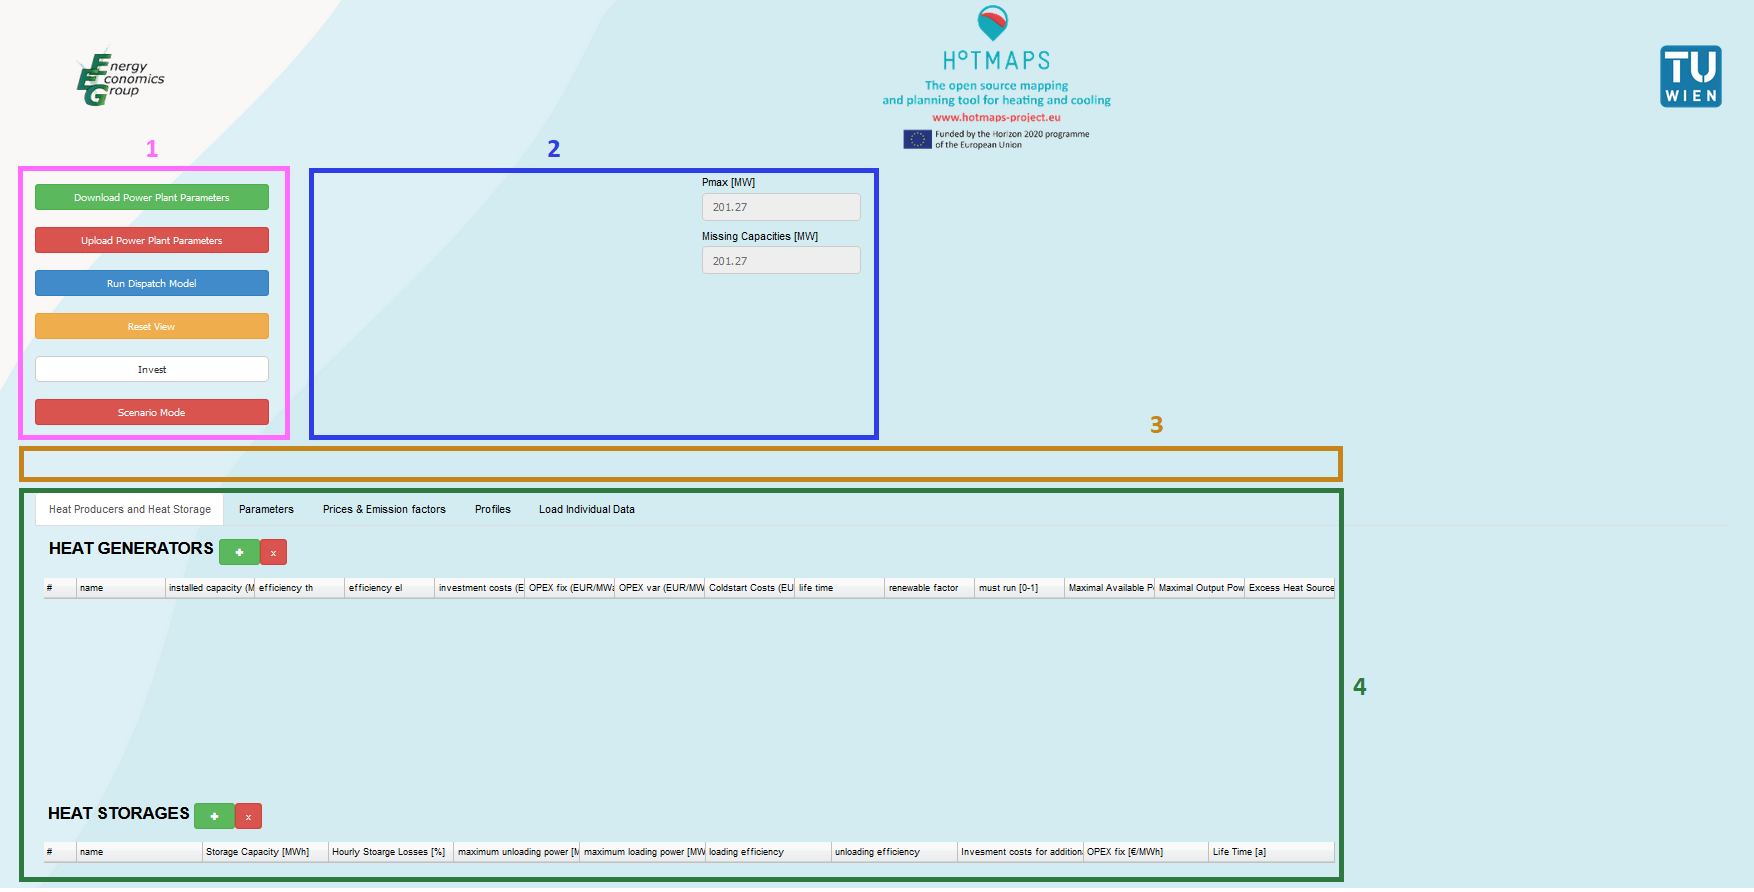
Fig. 2.1 The Web User Interface and its sections.
In the following subchapters you can find a more detailed description for each mentioned section.
2.1. Button section
Fig. 2.2 gives an overview of the different buttons.
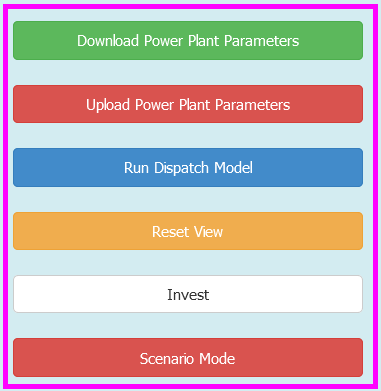
Fig. 2.2 Buttons
Here you have the choice between
Download Power Plant Parameters: download the created structure to save your progress after calculation
Upload Power Plant Parameters: upload your saved progress or a custom structure into the application
Run Dispatch Model: run the created model (if Scenario Mode is not used )
subsection:Reset: reset the view for a better workflow
subsection:Invest: start an investment model
Scenario Mode: run the created model through the scenario mode
2.1.1. Download Power Plant Parameters

By pressing this button, the browser will try to download a file with the name
download_input.xlsx that contains all the information regarding heat producers
and heat storages. The downloaded file has the following format: it consists of five worksheets, whearas these have a certain strucutre, as shown in detail in Fig. 2.3. The values would be filled, depending on the parameters which were set. In general, the file has the exact structure of the default_input_dispatch.xlsx, described in Scenario Generation.
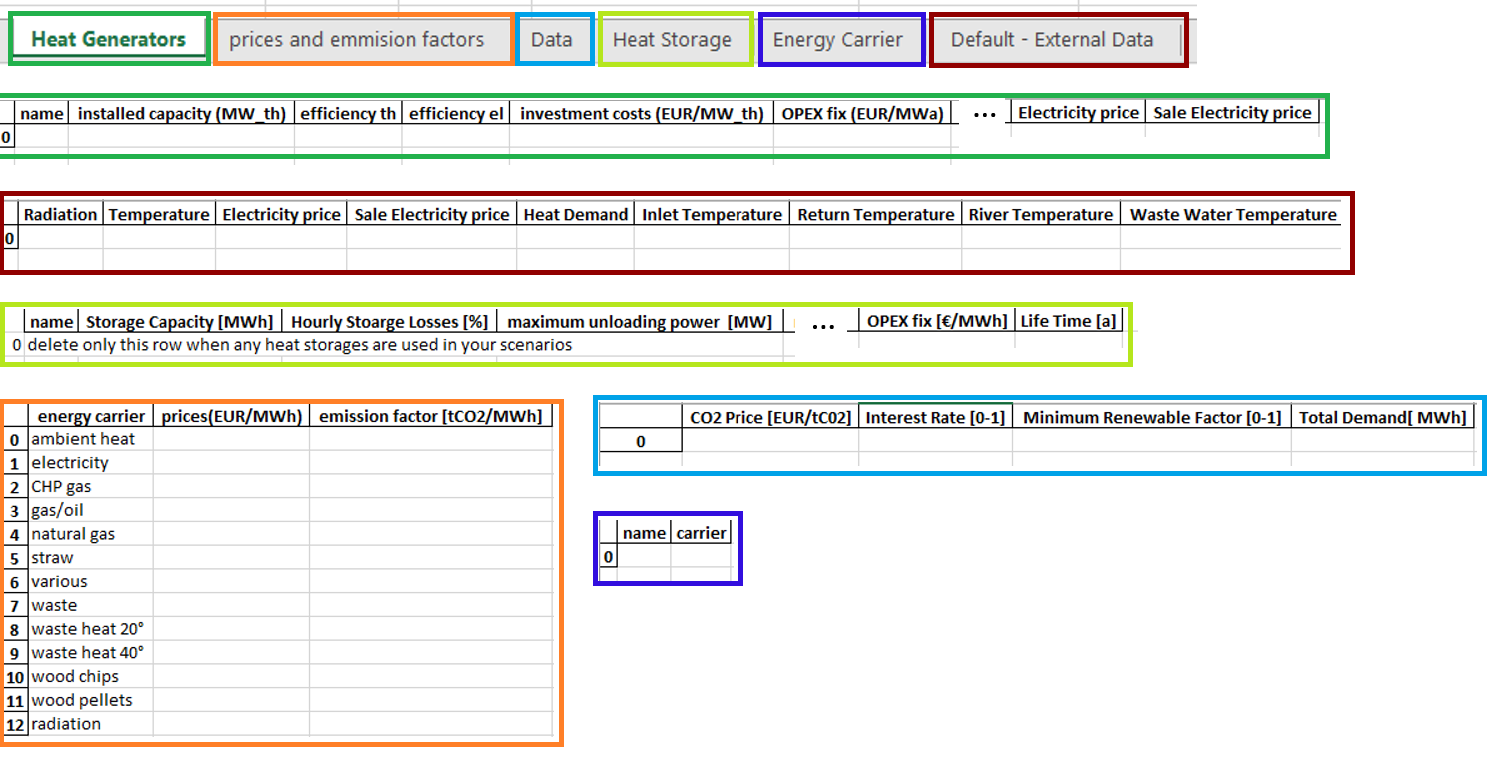
Fig. 2.3 Download file structure
2.1.2. Upload Power Plant Parameters

By clicking this button, a pop up window will open and you will be able to upload an xlsx file. That overwrites the content of the web user interface.
Warning
The file you upload must have the structure as described in Download Power Plant Parameters.
When uploading a file, the following points are necessary to know:
You have to create a file that has the same names for the worksheets (like displayed in Download Power Plant Parameters) and columns
The worksheet and column names are case sensitive
You must specify an index column starting with 0
You can create a maximum of 13 energy carriers
In Table 2.1, there is a list of available heat generator types. The types with a * define not predefined value types which haven’t been specified yet. All types of heat pumps are displayed in Table 2.2, where variable COP means a COP depending on the flow temperature, the return temperature and the heat source. In general, depending on the heat generator type, there are predefined values for switch-off, power reduction or sensitivity, which can and should be adapted to achieve different behavior of the heat generators.
name available (case sensitive) |
description |
implementation note |
|---|---|---|
CHP-BP |
Back Pressure CHP |
|
CHP-SE |
Steam Pressure CHP |
|
boiler |
heat boiler |
|
Solar Thermal |
Solar thermal plant |
At maximum selected radiation profile the solar power plant gives the maximum output |
Waste treatment |
waste incineration plants |
|
Waste Heat* |
Power plants that work with the unused heat from other power plants |
|
Geo Thermal* |
Geo thermal power plant |
|
Power To Heat* |
Power to heat devices |
heat pumps - variations |
description |
implementation note |
|---|---|---|
heat pump |
constant COP |
For temperatures < 0°C, the heat pump doesn’t work |
Heat Pump Air |
variable COP |
As reference it uses the outside temperature |
Heat Pump River |
variable COP |
As reference it uses the river temperature; for temperatures < 3°C it doesn’t work; linerar reduction of power between 6° C and 3°C |
Heat Pump WasteWater |
variable COP |
As reference it uses the temperature of waste water |
Heat Pump Ind. Wasteheat |
variable COP |
As reference a constant heat source was taken |
2.1.3. Run Dispatch Model

By pressing this button, the optimization will start. You will get a progress shown in the Notification section. Depending on the structure you create, the optimization will run for about 60 to 120 seconds. Please be aware that your browser might freeze at that time. After the solution is found the results are shown in the output section. You can download then the results via the buttons in the Notification section. Also, if something gets wrong you will get information there.
Note
If unexpected errors occur, please document and send detailed instruction to reproduce the error and send these instruction with a short problem description.
2.1.4. Reset View

By pressing this button, the notification section and the output section will be cleared, and you will get a “fresh” view.

2.2. Notification section
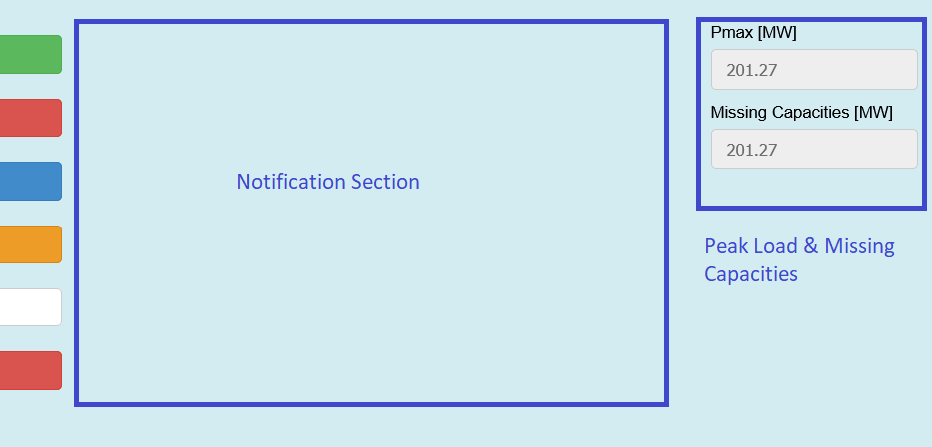
Fig. 2.4 Notification and missing capacity section.
In the following you will see some frequent messages (progress and error information) that might appear in the notification section. In general, the missing capacities section gives you an overview of how much capacity is missing to reach the peak load, like the notification in Fig. 2.13 shows.
2.2.1. After pressing Download Power Plant Parameters
Nothing to download Typically, this occurs when you want to download the initial page, to download you need to add first a heat generator.
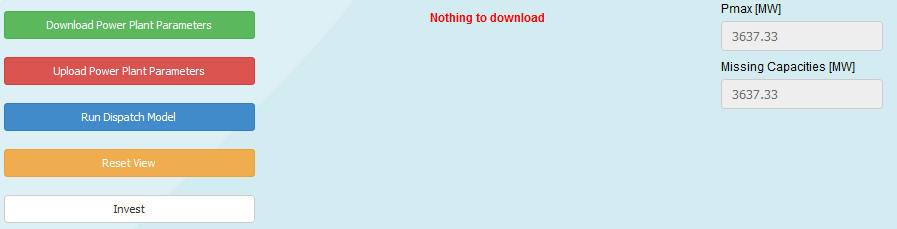
Fig. 2.5 Nothing to download
Download done
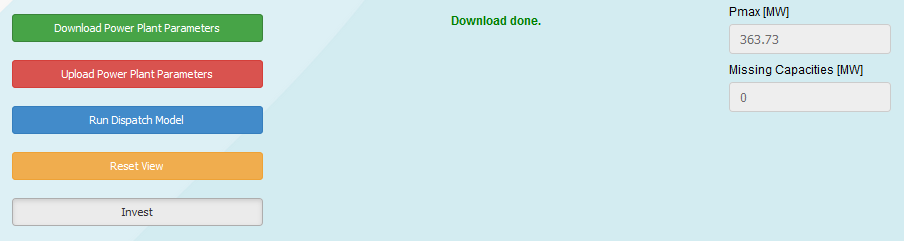
Fig. 2.6 Download done
2.2.2. After pressing Upload Power Plant Parameters
Not a valid file to upload
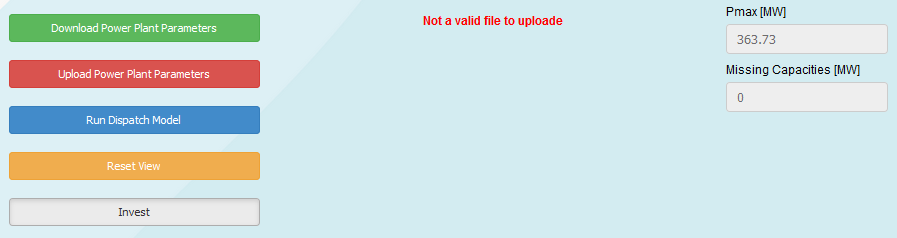
Fig. 2.7 Not a valid file to upload
This is shown when you try to upload an filetype other then .xlsx.
Fatal Error @ Update
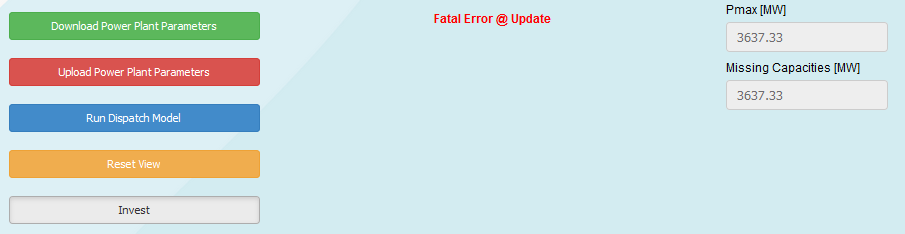
Fig. 2.8 Fatal Error @ Update
This is shown when your file you want to upload has not the needed structure, see Upload Power Plant Parameters.
Upload Done
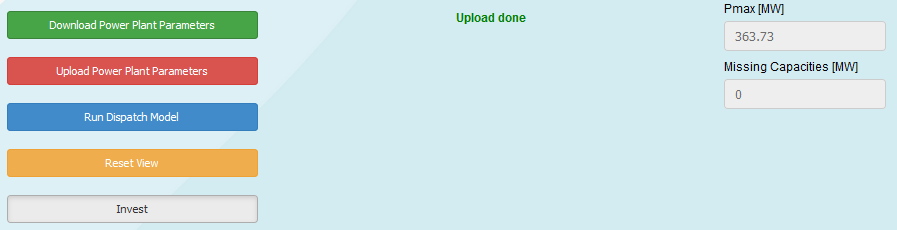
Fig. 2.9 Upload Done
2.2.3. After pressing Run Dispatch Model
Dispatch in progress, please be patient…
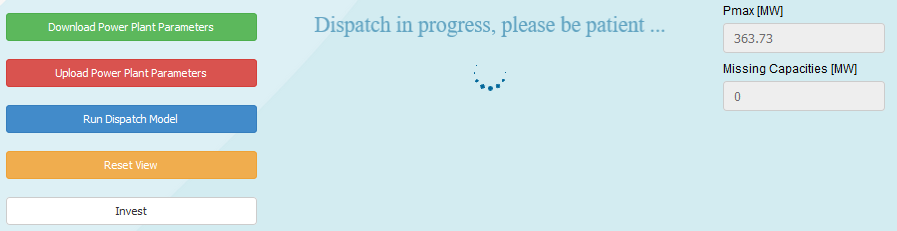
Fig. 2.10 Dispatch in progress
This can take some time. Typically, also to browser can freeze when the calculation is done and the results are rendered in the browser.
Calculation is done
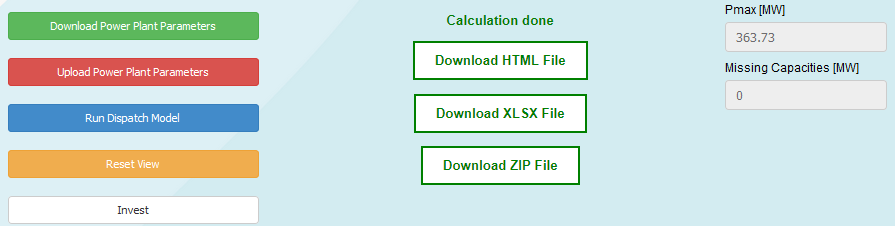
Fig. 2.11 Calculation is done
With these buttons, you can download your results. It might happen that the page freezes after downloading, please be patient. Therefore it is recommended to save the link of these files by (right) clicking on the buttons and choosing Copy Link.
Note
After 2 hours these links will not work but you can download the files directly if the page freezes and so save time.
No Heat Generators available
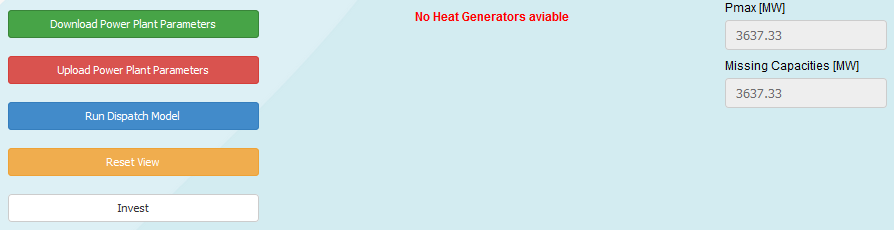
Fig. 2.12 No Heat Generators available
This will happen if you haven’t specified any heat generators and wanted to start the model from the initial page.
The installed capacities are not enough to cover the load
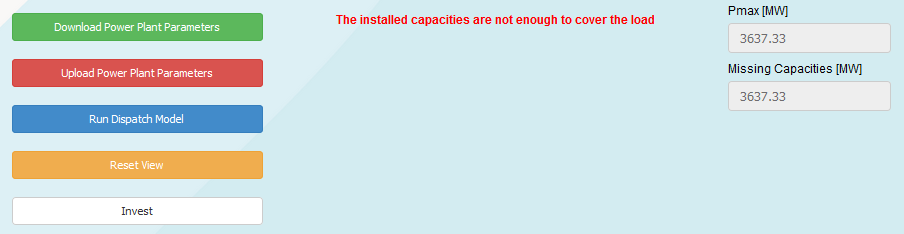
Fig. 2.13 Installed capacities are not enough to cover load
This will be shown when you haven’t specified enough MW to cover the peak load It can be checked via the Missing Capacities notification on the right sight of the notification section, see Fig. 2.4.
Error: Problem proven to be feasable or unbounded
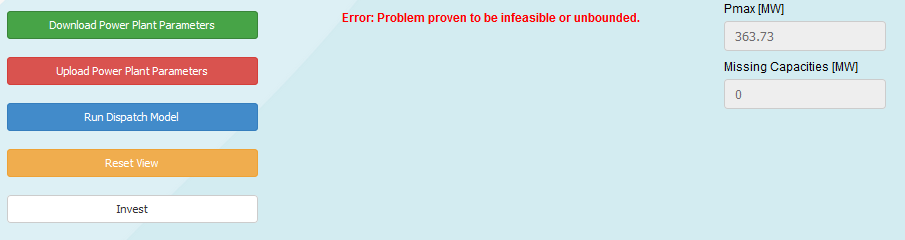
Fig. 2.14 Problem proven to be feasable or unbounded
This happens typically when constraints cannot be met. This can have a lot of reasons, its upon to you to think about what could happen.
Error: Please specify the technologies for the investment model
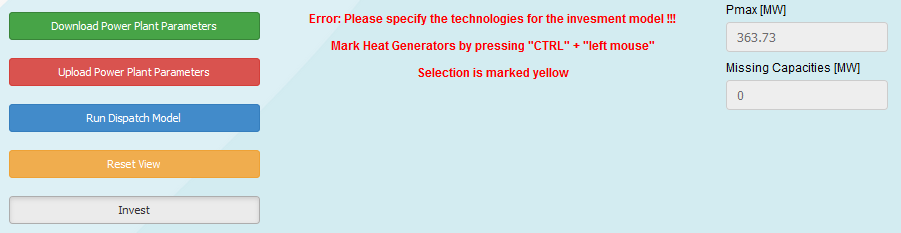
Fig. 2.15 Specify technologies for the investment model
This is shown when you enable investment planning but you forgot to select the heat generators and heat storages to mark, with whom it should do an investment optimization.
2.2.4. After pressing Invest

Mark Technologies by pressing “CTRL” + “left mouse”, Rows are marked yellow
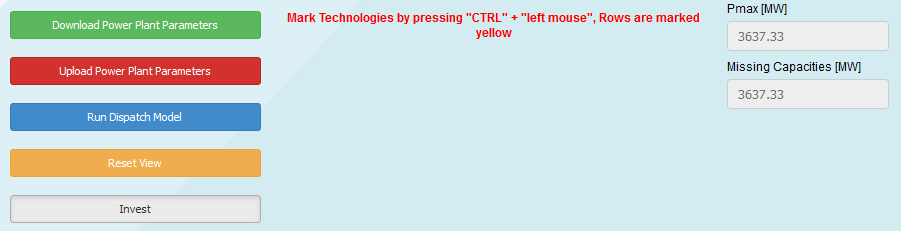
Fig. 2.16 Marking Technologies
As soon as you press this button you will see this information in the notification section, it tells you that you need to specify for which generators and storages to do the investment planning. If you don’t mark technologies you will get the message as described in Fig. 2.15.
2.2.5. After pressing other butttons
After pressing the
+button in the heat producers and heat storage tab
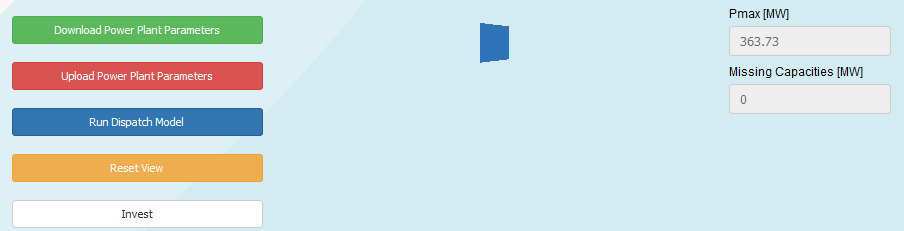
Fig. 2.17 Open heat producers and storage tab
This waiting spinner is especially visible after pressing the + button, typically
the browser freezes, so be patient, the add section is loading.
After Pressing the
✓ ADDbutton in the heat generator adding section Heat Generator ADDED
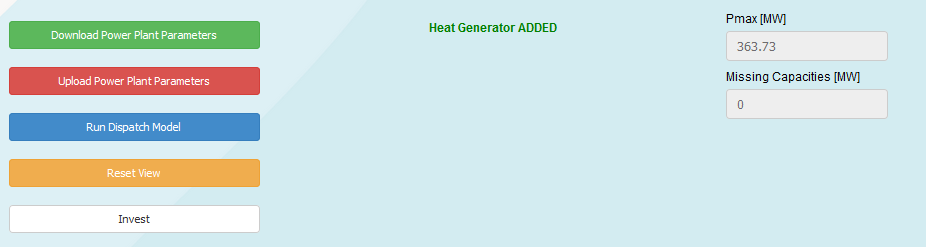
Fig. 2.18 Pressing ✓ ADD button
After Pressing the
✓button in the Sale-/Electricity Price Tab
Sale-/Electricity price Data is set as Default
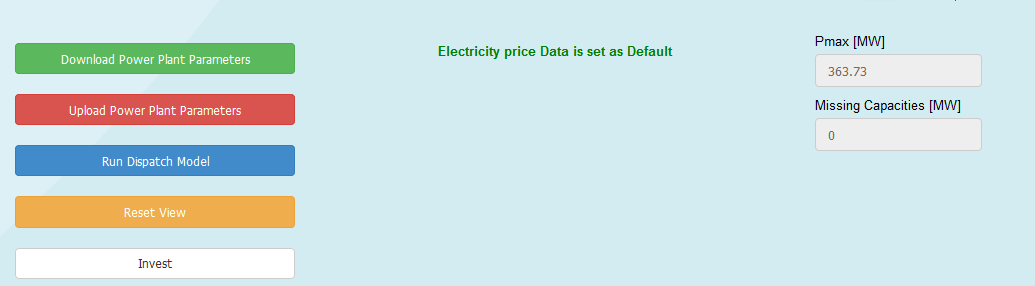
Fig. 2.19 Pressing ✓ button
Sale-/Electricity price Data for Heat Generator name is added
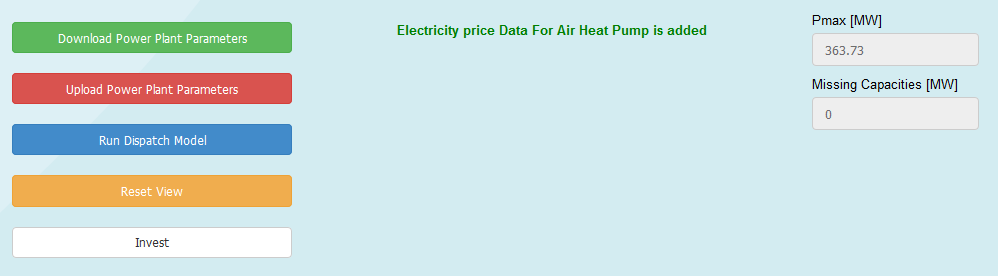
Fig. 2.20 Sale-/Electricity price Data
After Uploading a file in the Load Individual Data tab
Invalid Filetyp to load @ Loading External Data
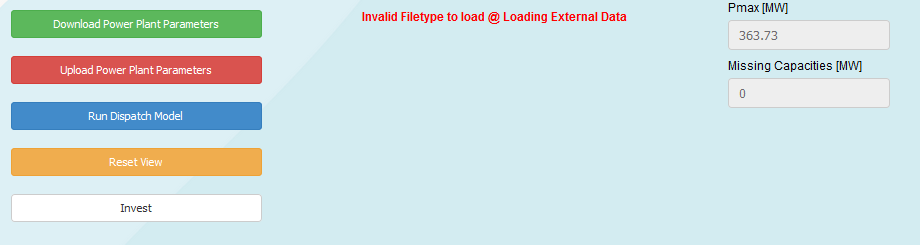
Fig. 2.21 Invalid Filetyp
This is shown when you try to upload a filetype that is not .xlsx or .csv
Your file has not enough values (please specify 8760 values)
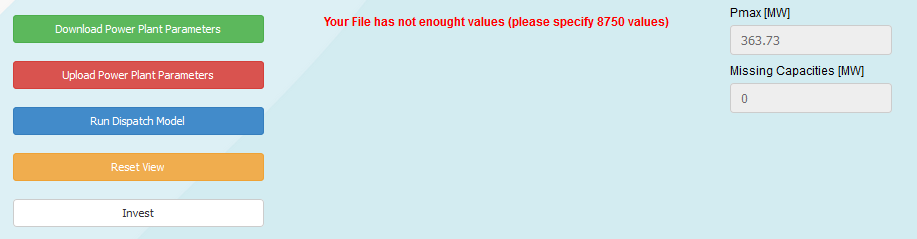
Fig. 2.22 File has not enough values
Your file that you upload has to have the structure as described in Inputs.
External Data Loaded
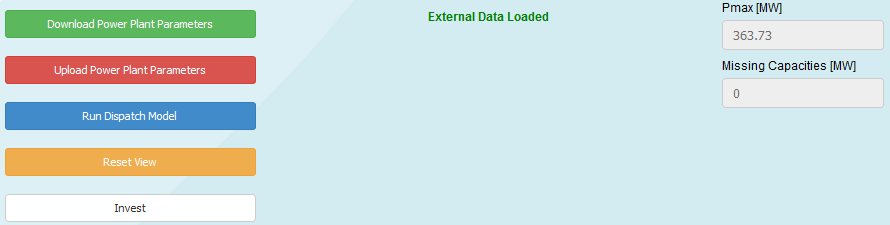
Fig. 2.23 Fullfilling the structure as described
This is shown when the external data has been uploaded.
After Pressing the ✓ Save button in the Load Individual Data tab
External Data DataName added to profile type as DataName_1
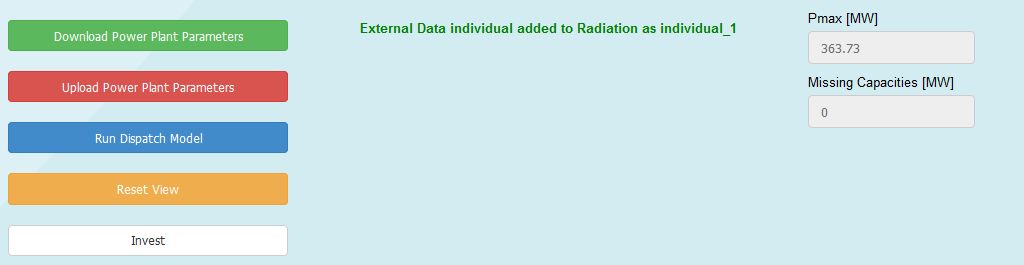
Fig. 2.24 External Data DataName added
This is shown after adding custom data to the profiles as described in Inputs.
n_th/COP - External Data added to Heat Generator name
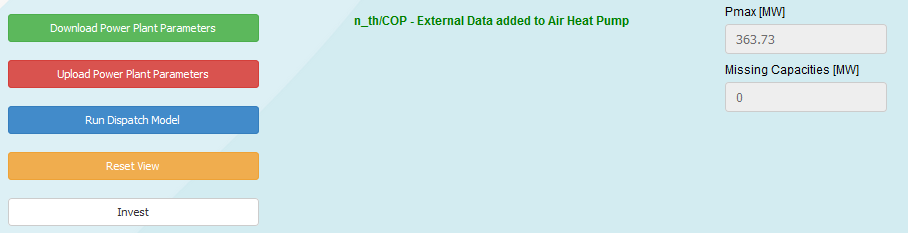
Fig. 2.25 n_th/COP
This is shown after adding a custom data for the thermal efficiency to a heat generator.
2.3. Output section
See Outputs for general information about the structure of the outputs, or see the specific mode chapters (Scenario Mode, Scenario Generation or in general Example Projects) for detailed information about the specific generated outputs there.