4. Scenario Mode
If you want to do sensitivity analyses you have to start a run for each parameter you want to vary, save the results and then change the value and run the calculation again, save the results and so on.
As you can see, this is a very time consuming and painstaking process.
To simplify this process there is the Scenario Mode.
For example if you like to include more sensitivity parameters such as different \(CO_2\) price values, then the easiest way to calculate is the so-called scenario mode. It gives you the opportunity to use more and different sensitivities and calculate it at once.
4.1. How to create a scenario
The scenario mode is designed on the basis of a two-level tree model. Fig. 4.1 illustrates this concept.

Fig. 4.1 Scenario Mode Design
If you want to create a scenario tree like Fig. 4.1, then creating it through the GUI is easy. Otherwise, if you want more sensitivity levels then it is simpler to create them via explicit excel files and/or use the Scenario Management Tool , which is described in Scenario Generation.
A possible task for the use of the Scenario Mode could be the following:
The aim is to examine 3 technology portfolios (Portfolio a, Portfolio b and Portfolio c).
For Portfolio a the impact of different CO2 prices should be investigated.
For Portfolio b the effect of different energy prices should be analyzed , and
For Portfolio c the effects of differnt interest rates and different system temperatures should be studied
This task can be described as a 2-stage scenario tree (Fig. 4.2,) and is simple to create with the integrated graphical user interface.

Fig. 4.2 Example of a Scenario Tree that can be simple and easy create through the GUI
When using the GUI to create a scenario, do the following steps
Enabling of the scenario mode, Fig. 4.3
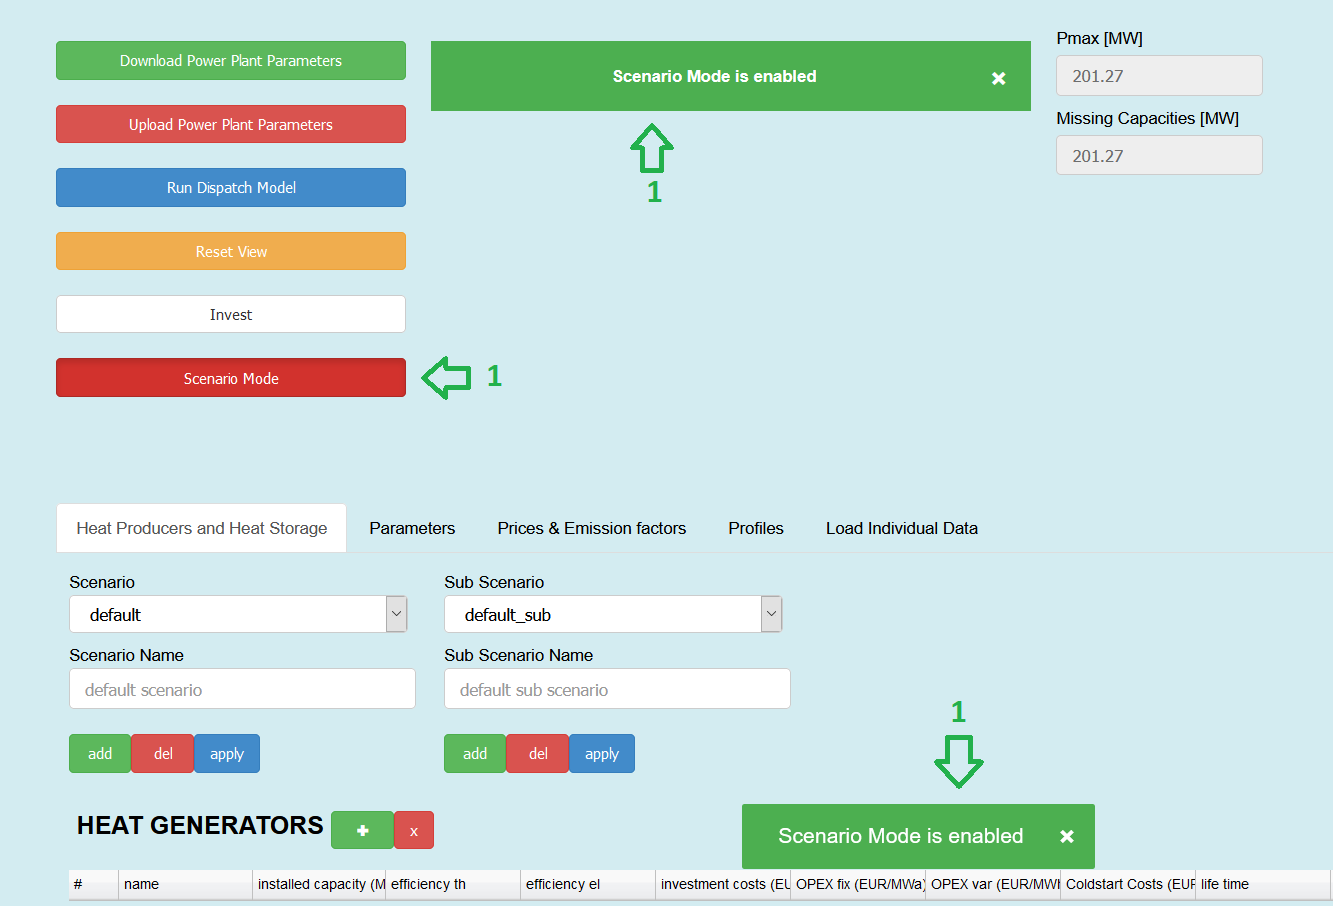
Fig. 4.3 Enabling the scenario mode
Choosing a name for the new scenario and sub-scenario, and apply the names, Fig. 4.4.
Choose a name for your scenario
Press apply
Then two messages should appear that your chosen name was adapted
The chosen name replaced the default filling
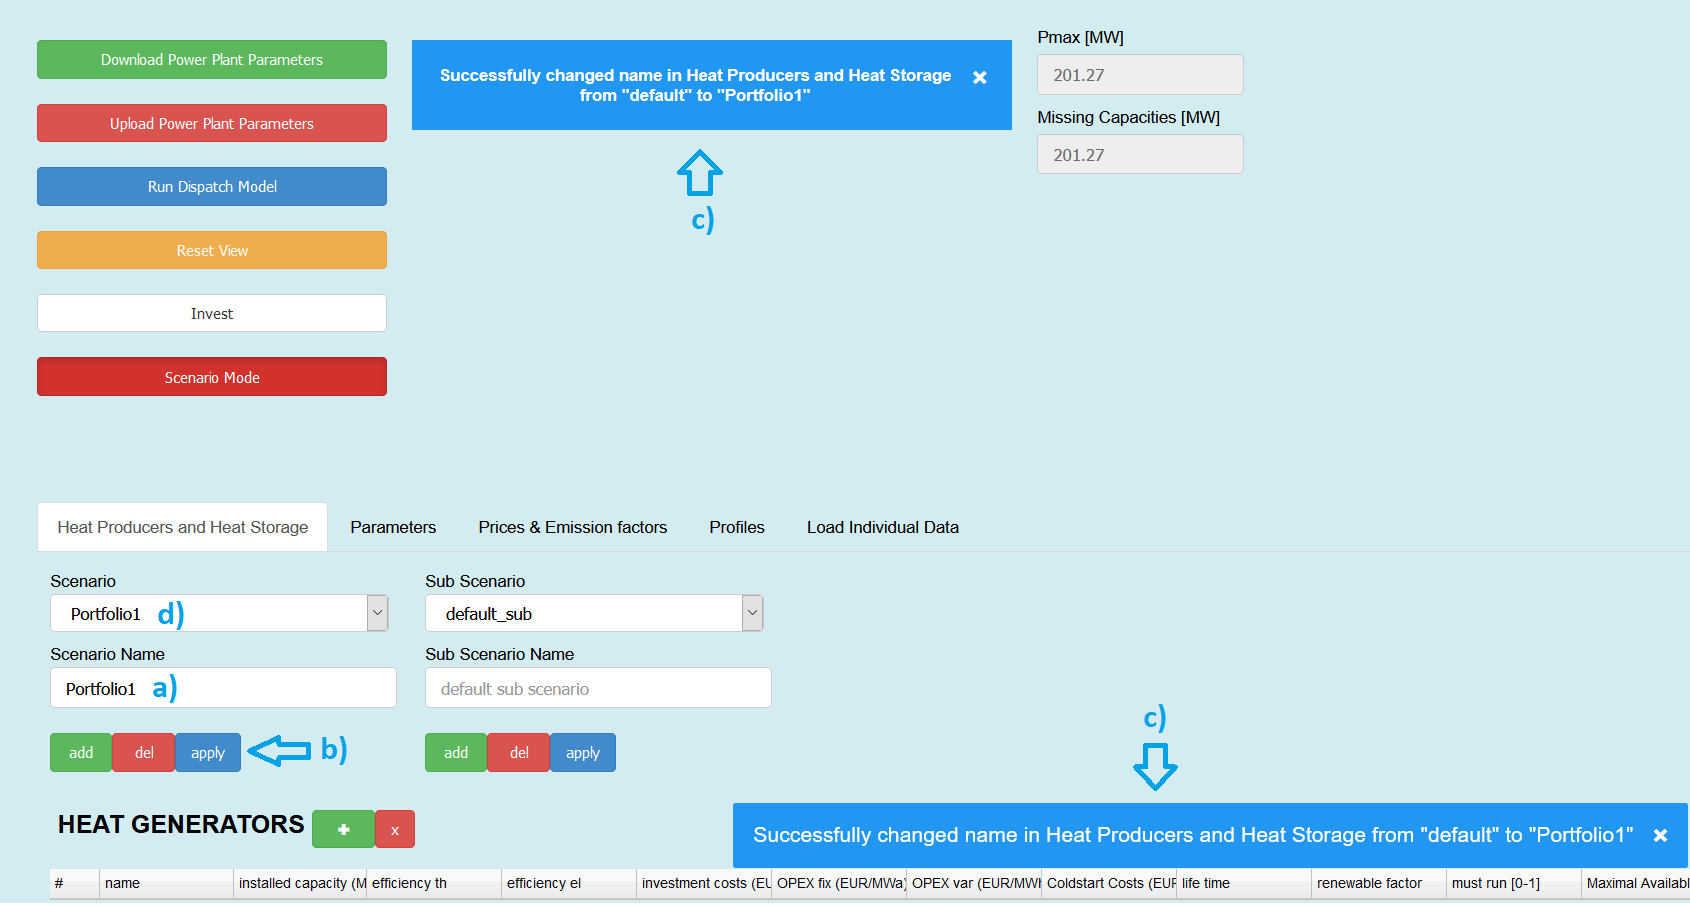
Fig. 4.4 Name the scenarios
Choose the names for the sub-scenarios, similar like the step for renaming scenarios, Fig. 4.5.
Go to parameters and choose a name for the first sub-scenario
Press apply
Then two messages should appear that your chosen name was adapted
The chosen name replaced the default_sub filling
Warning
Don’t choose a name for a sub-scenario with an underline _ symbol involved, as it may cause trouble, see Scenario Generation.
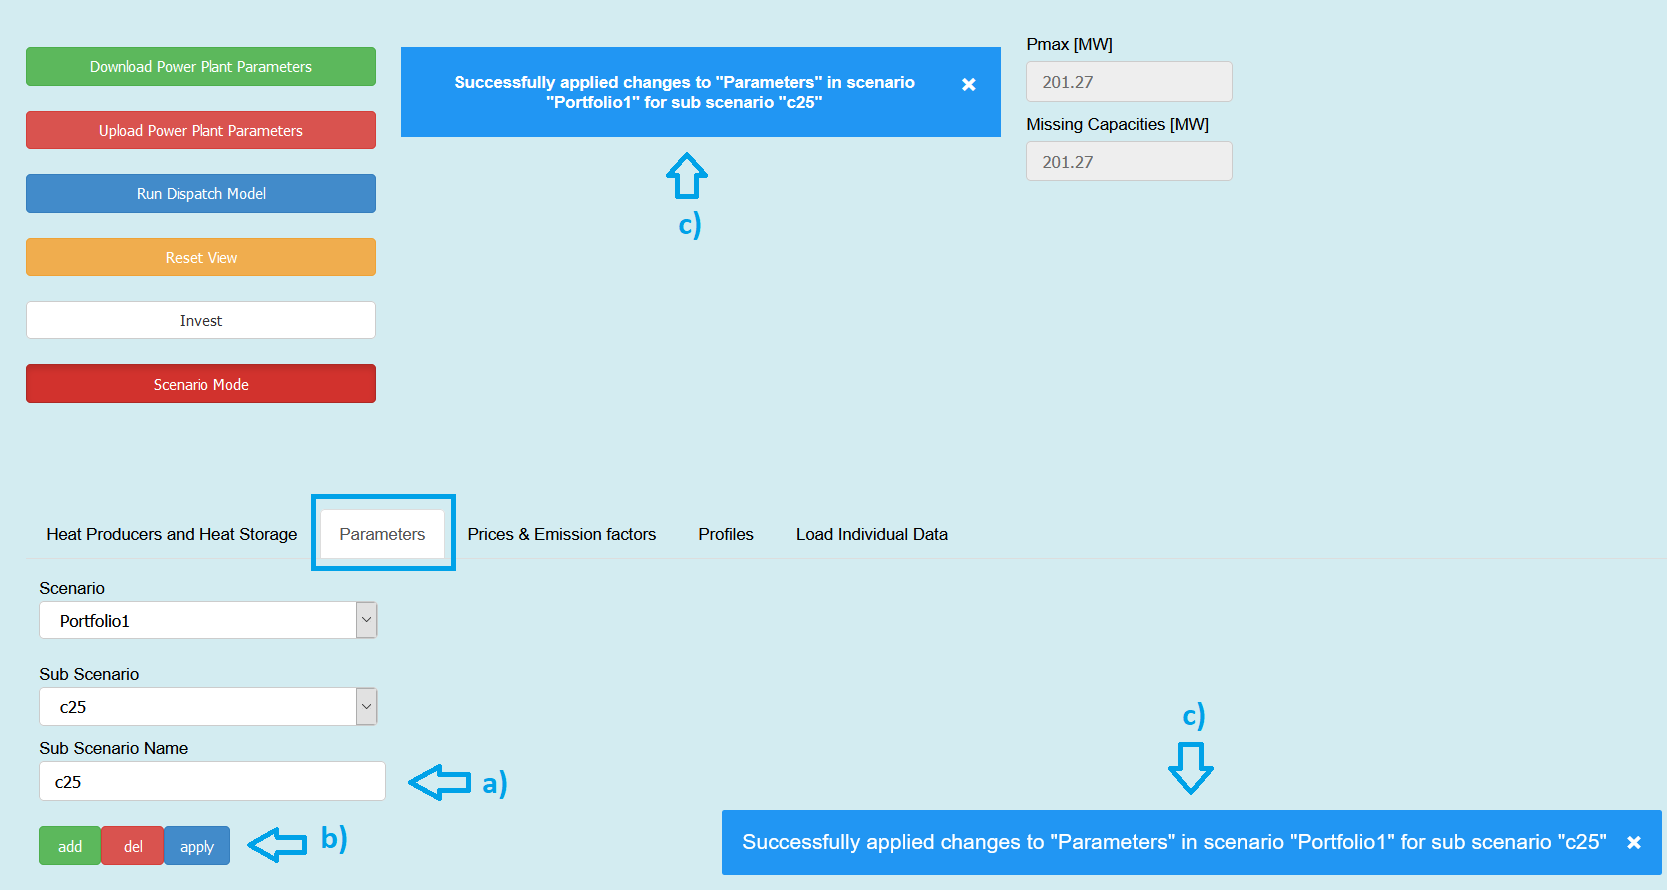
Fig. 4.5 Name the sub-scenarios
Tip
Choose a fitting name for your subscenarios, like in Fig. 4.5, as the name symbolizes which parameter was modified.
If you like to add more sub-scenarios with the same parameter modification as the first sub-scenario was made, then do the following steps:
Go to parameters and chose a name for the next sub-scenario
Press add, see Fig. 4.6
Then two messages should appear that your chosen sub-scenario was added
Via drop down, you should see now all the sub-scenarios you already created
Then the one parameter which differs through all sub-scenarios has to be set, so go to the one where the parameter has to be adapted (in this example it would be the \(CO_2\) price value) and choose the correct value, see Fig. 4.7.
If the values are adapted, then you should see the different values in the parameter box you have changed by clicking on one of the sub-scenarios, see Fig. 4.8.
Warning
If you have made a mistake and you want to have a different value for a sub-scenario, the text field with the sub-scenario name must be empty before you change the value with apply, otherwise the application thinks that you want to make a new sub-scenario and since the name is already assigned, an error will occur that you cannot rename an already existing sub-scenario.
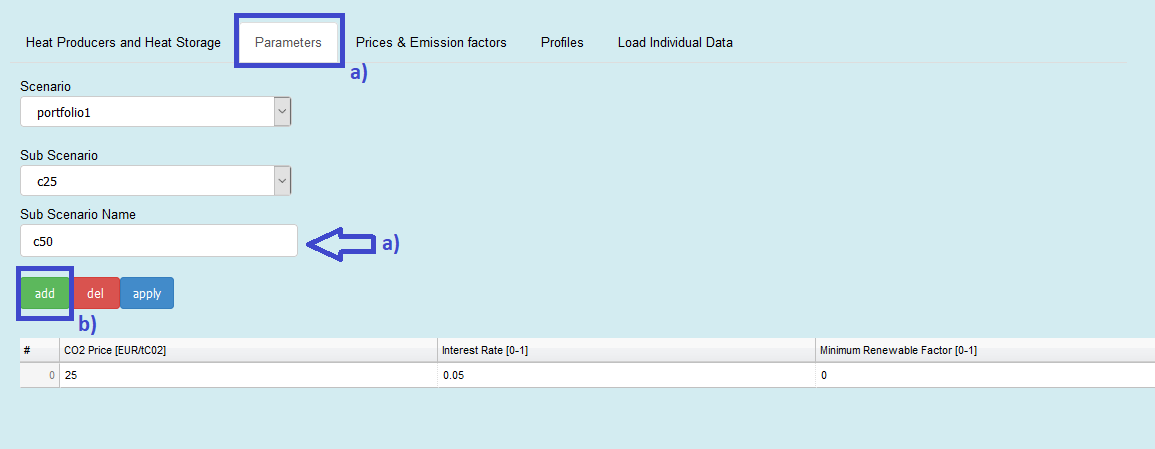
Fig. 4.6 Creating additional sub-scenarios, step one
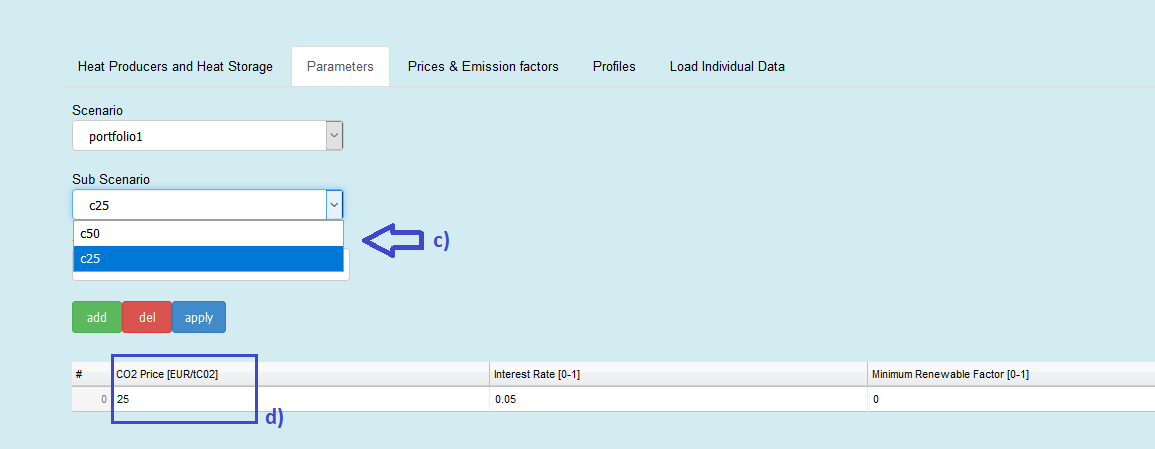
Fig. 4.7 Creating additional sub-scenarios, step two
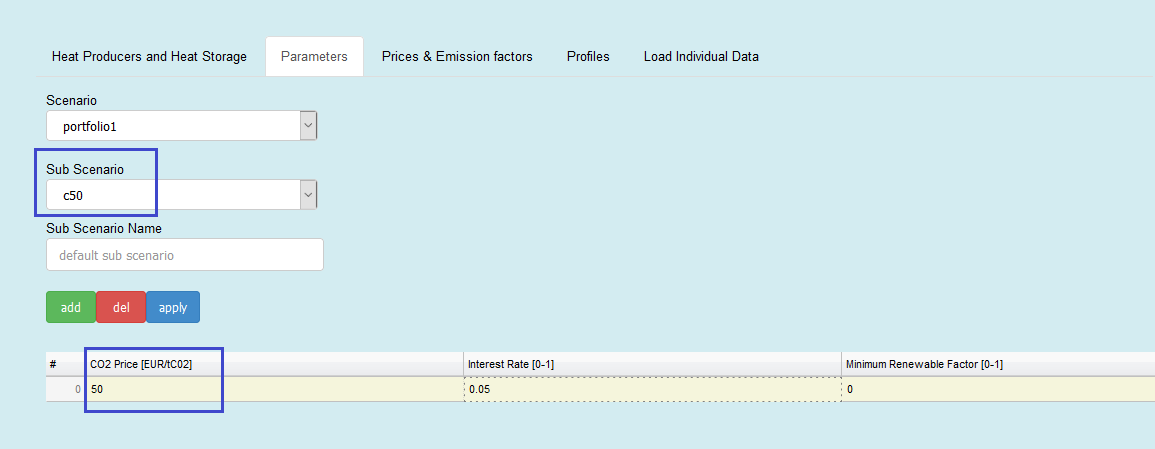
Fig. 4.8 Creating additional sub-scenarios, step three
If you have created all the necessary sub-scenarios, you need to click on Run Dispatch Model to calculate your individual scenario. On the right side of the button you can see the calculation process, depending on the number of sub-scenarios, see Fig. 4.9.
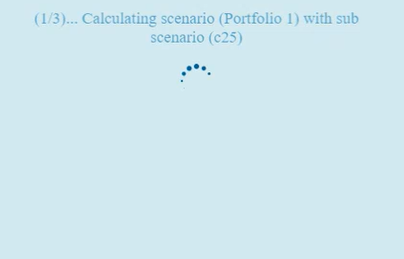
Fig. 4.9 Run the created scenario.
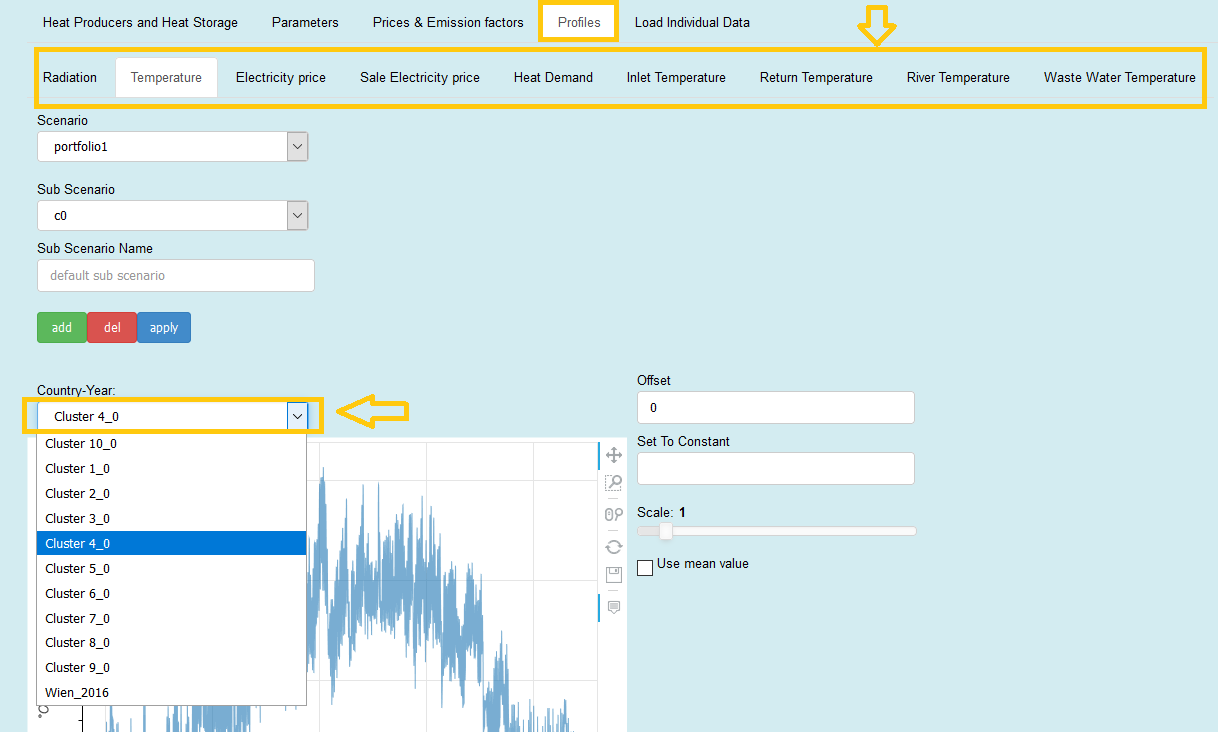
Fig. 4.10 Choose your profiles for each category.
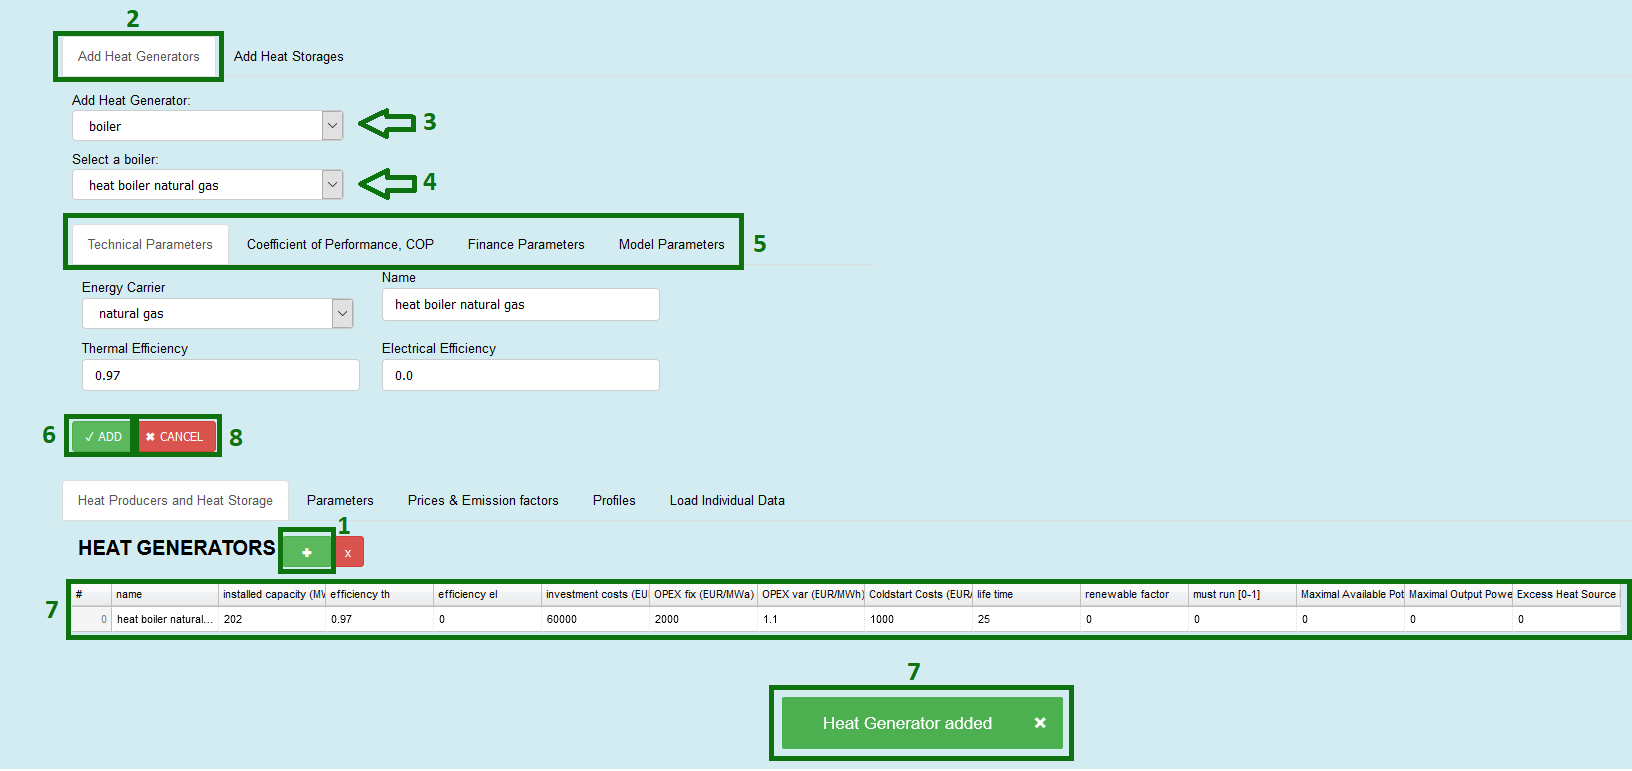
Fig. 4.11 Add heat generators to run your model.
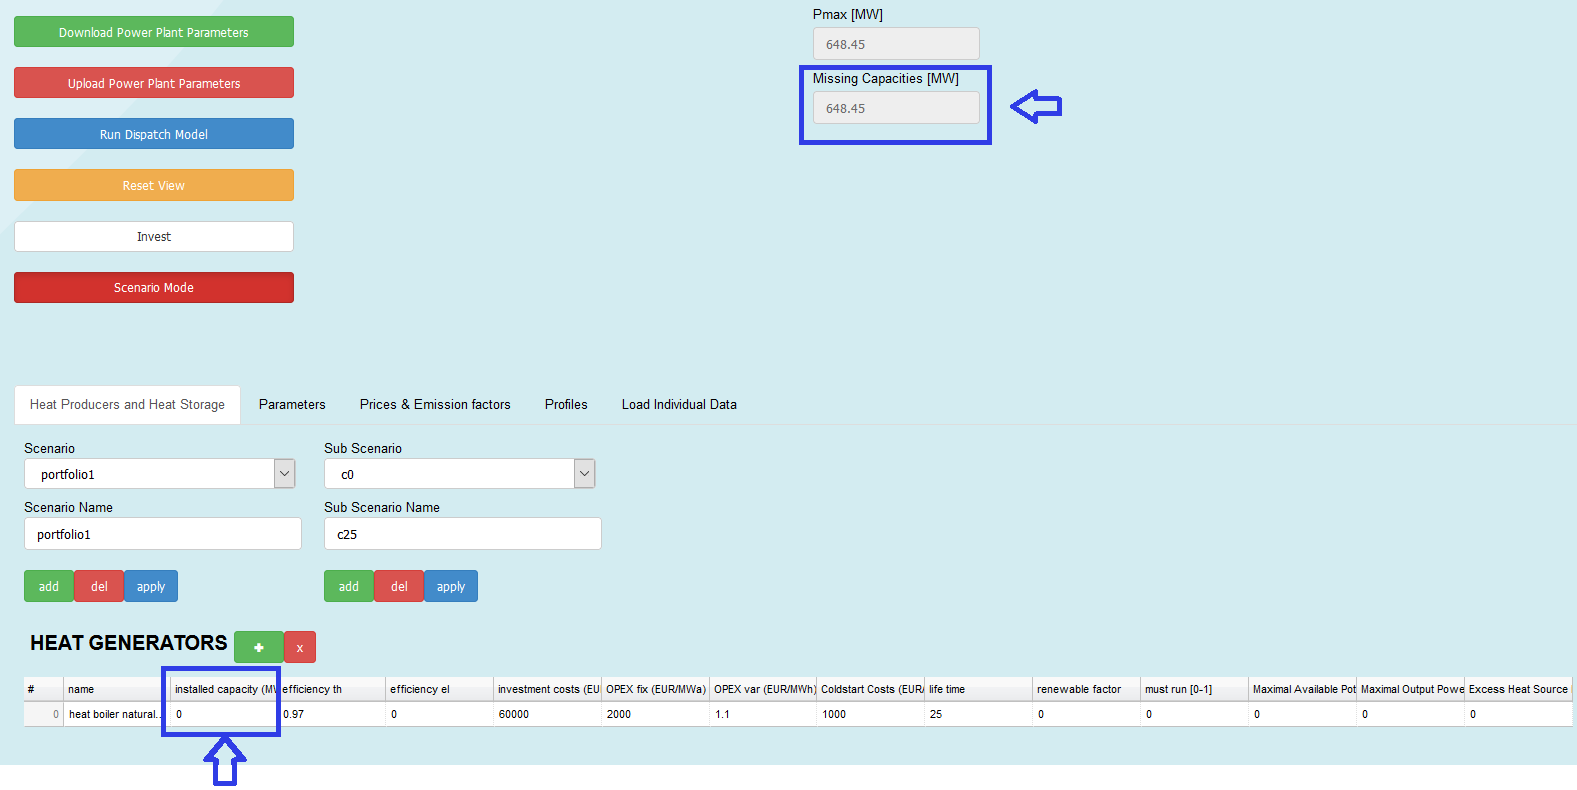
Fig. 4.12 Avoid missing capacities.
Warning
Make sure you
have filled up all the categories in profiles with a valid profile (Fig. 4.10), for details see Inputs.
have created a Heat Generator, Fig. 4.11 (follow the steps in the figure, for detailed information about the steps, especially step 5, see The Web User Interface.
have chosen the right installed capacity so that no missing capacity is possible, Fig. 4.12.
Otherwise you won’t be able to run the model and get resuts, as you get error messages before.
Tip
After you have created your scenarios via the web interface, you can press Download so that you save your progress and do not lose the system you have created.
After you have pressed Download, a zip is downloaded.
The zip file has the following structure:
    scenario_inputs.zip
        ├───Scenario 1
        │       Sub Scenario 1.xlsx
        │       Sub Scenario 2.xlsx
        │		<>...xlsx
        ├───Scenario 2
        │       Sub Scenario a.xlsx
        │       Sub Scenario b.xlsx
        │       Sub Scenario c.xlsx
        │		<>...xlsx
        └───<>
        │		...xslx
        ...
The folders describe the scenarios and the output files is also named after them.
Within each folder (scenario) you will find Excel files that describe the sub-scenarios and also the outputs files are named after them.
The system for the scenario tree described in Fig. 4.2 has folowing structure
    scenario_inputs.zip
        ├───Porfolio a
        │       CO2 High.xlsx
        │       CO2 LOW.xlsx
        │
        ├───Porfolio b
        │       Energy Carrier Prices HIGH.xlsx
        │       Energy Carrier Prices LOW.xlsx
        │       Energy Carrier Prices MID.xlsx
        │
        └───Porfolio c
                Interest Rate 10%.xlsx
                Interest Rate 2%.xlsx
                System Temperatur HIGH.xlsx
                System Temperatur LOW.xlsx
Having this structure in mind, you can define your scenarios manually via Excel files without the web user interface. A more detailed description of the an automated process of this can be found in Scenario Generation.
You can upload the zip file again and read the scenarios into the model check/change values and calculate the scenario tree at once.
To upload a scneario tree you must always proceed as follows:
Enable Scenario Mode
Upload Power Plant Paramters
select zip file and press ok
4.2. Scenario Mode Output
There are two options of saving the output of the scenario calculation:
Data will be saved automatically in this path, if you have everything locally saved:
...\Dispatch\app\modules\common\AD\F16_input\staticwith the following structure:
scenario mode folder: one folder per scenario, which is named by the exact date and time when the scenario was run.
Inside that folder, the structure looks always like this:
scenario folders: folders named by the created main scenarios (number of folders depends on the number of created scenarios)
sub-scenario folders: folders inside the main folder defined by the created sub-scenarios (one or more); here you always find data and generator files with single value, which is explained in Table 4.1.
HTML file : will be created automatically, it shows you the results via plots and separates it, depending on the different scenarios you made.
The structure is shown in Fig. 4.13.
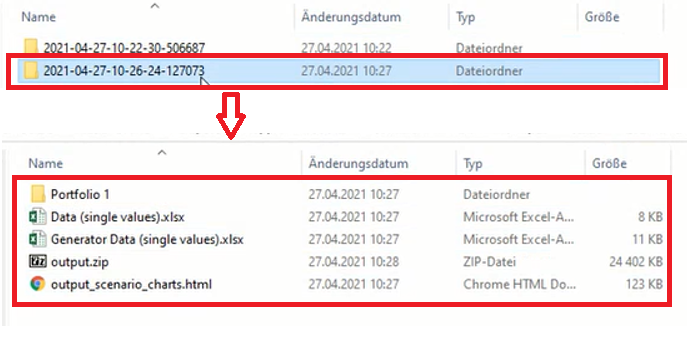
Fig. 4.13 Folder structure of scenario output.
single value |
hourly value |
|
|---|---|---|
Data |
big categorties/ indicators (e.g. whole costs, not specified for each technology) ; data is displayed as one value per indicator |
big categorties/ indicators (e.g. whole costs, not specified for each technology) ; data is displayed as hourly values for the whole year |
Generator Data |
categories per technology (e.g. \(CO_2\) price per technology or installed capacity); data is displayed as one value per indicator |
categories per technology (e.g. \(CO_2\) price per technology or installed capacity); data is displayed as hourly values for the whole year |
Data can be downloaded separately from the server by clicking at Download ZIP File, see Fig. 4.14.
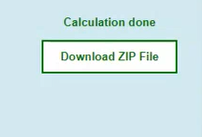
Fig. 4.14 Download possibility after calculation.
Inside the zip-file, you find as many folders as scenarios were created. Here, you don’t have explicitly an HTML file or other excel output files as option one has. Inside these folders you find as many folders as you have created sub-scenarios.